I. Current status of enterprise energy management
1. Rough energy management
- Only total energy consumption data
- No understanding of energy consumption data of processes and facilities
- Lack of energy management mechanism
2. Basic energy management
- Arrange staff to perform manual meter reading, summarize and tabulate meter reading data
- Simple meter reading and power monitoring system in place
- Lack of statistical collation and analysis of large volumes of data
3. Efficient energy management system
- Analysis and collation of energy consumption data
- Apportioning energy use and energy costs
- Generation of various key energy consumption indicators
- Demand-side management based on the system's analytical data
- Waste detection using the energy management system
- Using energy management systems for performance appraisal

At present, most enterprises' energy management only measures the total meter of each energy item, resulting in the lack of data on energy consumption of each unit, the inability to refine energy consumption items, the lack of energy-saving analysis and control, and the inability to assess energy consumption over the limit. Most of the energy meters in each plant rely on manual meter reading, which has problems such as heavy workload, long meter reading cycles, inaccurate data, inability to detect energy wastage and leakage timely, inability to query historical data, and inability to provide real-time alarms.
III. Introduction of industrial energy management system
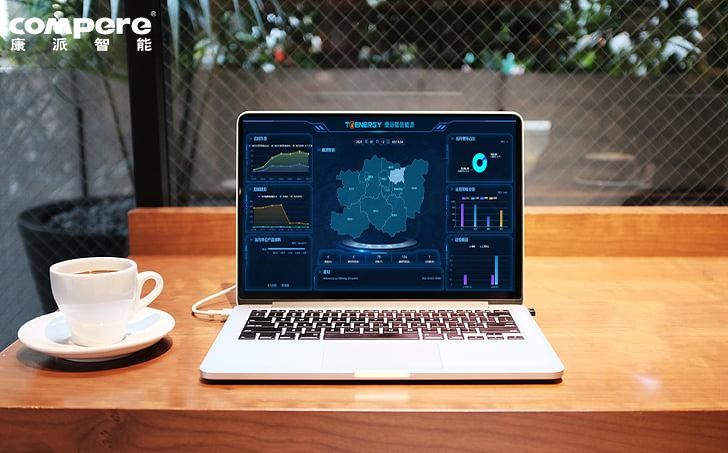
The industrial energy management system includes centralized monitoring, management and decentralized control of water, electricity, gas, cooling, heat, coal and other energy usage conditions, as well as on-site pressure, temperature and humidity, visual images, biometrics and other parameters. Based on regional data, combined with the effective use of "Internet + Big Data", the system can be freely combined into multiple "energy consumption units" to achieve real-time monitoring, unit consumption indicators, comparative analysis, expert evaluation and energy forecasting through a smart energy management platform.
1. Equipment graphics display
The graphics can be displayed under different organisations, including plant plan, power system diagram, water tower system diagram, process flow diagram, energy balance diagram and other graphics belonging to different energy types and different graphic types, and the graphics support dynamic display.
2. Statistical analysis
The energy consumption data of the energy consumption units can be queried and analyzed year-on-year, the comparison results can be displayed in the form of bar graphs and the query data can be exported. Comparative analysis of energy consumption data between different energy consumption units can be carried out, and the energy consumption units can be defined by the company itself. Provides data statistical and comparisons, and available for export.
3. Operational analysis
Data query and comparative analysis of different operation rules under the same energy consumption unit, presented in the form of a bar chart. Operating rules can be set within the system by hourly/daily rules. The energy consumption data of different shifts in the same energy consumption unit can be queried, and the energy consumption data between different shifts can also be compared and analyzed.
4. Energy efficiency assessment and analysis
Energy costs can be calculated according to the cost of the different energy types, and apportionment factors can be set for energy shared by different energy consumption units. Three additional functions are available for electricity: time-of-day billing analysis, basic electricity cost analysis and power factor analysis.
- Inquiry the cost of different energy types.
- Time-sharing billing analysis, statistical analysis of electricity prices for the peak-top-flat-valley electricity consumption periods, and comparative display in bar charts, the system gives corresponding electricity consumption period suggestions according to the calculation results.
- Basic tariff analysis, the system calculates the tariff according to capacity and demand and presents it in the form of a bar chart for comparison, giving advice on payment and providing details of transformer demand at the time of enquiry.
5. Reporting service
The reports are divided into equipment reports, energy consumption unit reports and custom reports. The reports can be exported in hour/day/month/year, etc.
6. Energy plan management
The energy plan management module is used to develop energy plans that ensure a balance between energy supply and demand. The long-term plan for energy supply and demand (static plan) is drawn up by the plant-wide management system, while the daily plan for the energy management module is prepared according to the production plan for the following day issued by the plant-wide management system.
The industrial energy management system can effectively reduce the costs incurred by enterprises for energy consumption data statistics, data processing and report. Through online analysis of monitoring data, it helps enterprises to carry out real-time monitoring, accurate statistics and detailed forecasting of energy consumption, ultimately providing a conclusive data basis and powerful decision-making support for energy saving and self-improvement.